Introduction

You all know the story. Tom Brady conspired with his equipment manager and a locker room attendant to deflate footballs at the AFC Championship game in 2015. Or is this what really happened?
The Patriots say no. The referees used one of two different gauges to measure the pressure in their footballs. Both gauges were examined and the values corrected to match the actual pressure. The measurements with the so-called Logo Gauge agree with the Ideal Gas Law of Physics. No tampering occurred.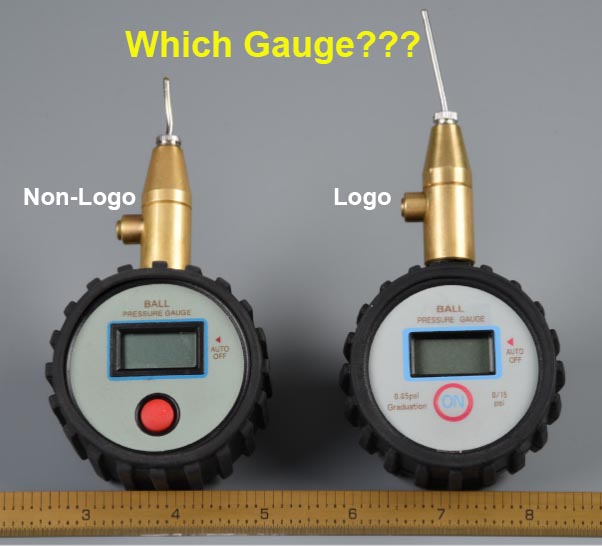
The NFL says yes. In the Wells report, the NFL scientists found that the measurements, regardless of which gauge was used, were not consistent with their experimental results. Tampering with the footballs must have occurred.
This workbook and interactive game day simulator is designed for people with rudimentary knowledge of physics to walk through the events of that day, and understand what happened to those footballs, the gauges and how there can be a difference between how the two sides look at this event. In this workbook, we will use the evidence, data, and experimental information found in the Wells Report, and perform our own calculations and our own experiments to come to our own conclusions.
Skip This Section — The Quick Answers.
Don’t peek, these are the answers, but if you have to because you are not very good at logical deduction, or you don’t want to solve mathematical problems, and don’t ever perform experiments, here are some of the things you will find out. These are not the first time these answers have been presented, others have already done so, but are put together here coupled with an interactive simulator to give you a chance to play out the physics yourself.
We will discover that the Patriots are correct, and with the use of the Logo gauge, the football measurements agree with the Ideal Gas Law. In the Interactive Simulator you can quickly find solutions which allow both the Patriots balls and the Colts balls to agree simultaneously.
We will also discover that Figs. 27 and 28 of the Exponent report, which were used decisively by the NFL in their conclusion that neither gauge matches the Patriots measurements, are simply not reproducible, do not follow the Ideal Gas Law, and indicate a mistake by the NFL scientists in the experimentation or presentment of those charts.
Further, a logical deduction made by the NFL scientists, based on incomplete information provided by the NFL, led them to believe that the Non-Logo gauge was used to measure the footballs. This deduction was incorrect, and contradicted by information provided by testimony of the individuals involved with handling the footballs, as revealed in another section of the report. In fact, as problem 1 below will show, the Logo gauge must have been used.
So, the pressure data, the testimony, the weather information, the timing, are all consistent with the pressures measured in both the Patriots and the Colts footballs as measured at half-time, if we use the Logo gauge.
However, we will find that the NFL scientists are right that if we use the Non-Logo gauge, which is the gauge the NFL scientists claim was used, the Patriots pressures lie slightly below the expected range by an amount imperceptible to any human hands including an NFL quarterback, and we have to look for some other effect (including removing some air, but also the cold playing field, and other effects could have happened).
In the first section, we will discover that the pre-game preparation and measurement by the Patriots equipment manager and the referee’s foggy memory, all point to the Logo Gauge being used for the measurements. In fact, if the information in the Wells report is accurate, it is highly unlikely, if not impossible that the Non-Logo gauge was used for the Patriots measurements, and a toss-up as to which gauge was used for the Colts measurements.
Based on this information, it is very unlikely, if not impossible that the Patriots deflated the footballs, or if they did, it was by an imperceptible amount.
Background
A study of the lowering of the pressure was performed by a company called Exponent, as part of an NFL investigation by Ted Wells and Company, and ended with a report we call The Wells Report. That report concluded that a .2psi difference in pressure was sufficient to declare that the balls had been tampered with.
Everyone, including the NFL scientists, agrees that footballs lose pressure as the temperature drops. 7th grade science projects are now showing what most of the NFL didn’t know when the initial accusations about the Patriots footballs occurred. The loss in pressure is natural and follows the Ideal Gas Law. At the pressures and temperatures we are talking about, the pressure loss is slightly more than 1psi for a 20F drop in temperature — or .05psi per degree Fahrenheit.
Everyone is also in agreement that footballs lose additional pressure when they are wet. And wet balls transition in pressure more slowly when the temperature rises. This is due to evaporative cooling — although it was not called such by the Exponent scientists, the physics and experimental evidence are undeniable, and both sides acknowledge its effect.
Everyone agrees that the Patriot footballs lost pressure, and that the pressure drop due to the physical phenomena above accounted for almost all of the Patriots decrease in pressure.
The problem comes about because of a small difference in pressure shown by the NFL model of events. They claim that a small amount of the pressure difference between the Patriots balls and the Colts balls as measured in the officials locker room is not due to any natural cause. That pressure difference was a .2psig below the bounds of what their experiments showed the balls should be.
Hard to imagine what that pressure difference means? Think of the tires on your car. You may normally inflate them to about 30 psig. Let’s assume that is at 72F. If the temperature drops to 68F, then you will lose about .2psig. Have you ever worried about the pressure difference in your tires when the temperature drops from 72F to 68F? If it sounds pretty insignificant, it is. Could you even measure it with the typical pressure gauge you use, let alone notice any effect in the control of your car? In the dial pressure gauge I use to measure my car tires, which I could also use to measure the pressure in a football, that amount of pressure difference is about the width of the needle.
Well, footballs are not much different. This is an almost insignificant amount of pressure in terms of normal usage. In fact, the gauge the referee used in deflateGate was inaccurate by about .35psi — almost double the pressure difference we are concerned about — and no-one had noticed anything in all the time he had used that gauge to measure footballs. And with all the brouhaha surrounding DeflateGate, no-one has found that a .2psi pressure difference could be detected by even the most sensitive of quarterbacks, let alone influence the outcome of a game.
However, this insignificant amount of pressure is what the science debate is about. It is almost inconceivable, given the conditions of the day, the chaos in which the data was taken, and the many other small variables that could be added into the mix, that the NFL scientists could even measure with any statistical significance this small amount of pressure difference. But that is what they claim they did.
The NFL reached a conclusion that a locker room attendant slipped into a bathroom with the balls and deflated them by that small amount. The Patriots, and a growing number of other people contend that not only does that not make sense, they contend that such a conclusion is not supported by the science of the matter, and contradicts the testimony of everyone involved in the matter.
So now it up to you to decide. Here are a set of exercises and experiments which can take you through the timeframe. Unless otherwise noted, we will use data and background information available in the Wells Report.
Another Thing to ignore: my editorial —
The reason for pursuing this question is to maintain the integrity of science. A lot of people are under the impression that there is scientific support for the accusations against the Patriots. In actual fact, there is not. The NFL may decide to pursue this on other grounds, but please, don’t say there is any scientific evidence that unnatural deflation occurred.
Some others say that because of the legalities involved with labor laws, etc, this may reach the Supreme Court. Keep in mind this is all about unfair labor practices and application of the law, not about the science. The Supreme Court will be ruling on labor laws, not on the Ideal Gas Law, however intriguing and/or ridiculous the headline “Supreme Court Overturns the Ideal Gas Law – Votes Against the Patriots” might sound to some people.
Investigation #1. Frictional Heating of Footballs, and the choice of a Pressure Gauge
The Wells Report relates this story about the preparation of the Patriots footballs:
“Jastremski told us that he decided to prepare another full set of game balls, and that, by mid-Sunday morning, he had removed the initial preservative from 24 new footballs, brushed them and treated them with dirt. He and other members of the equipment staff then gloved the footballs, spending between 7 and 15 minutes vigorously rubbing each ball. According to Brady, this created a set of game balls where most of the tack on the ball ended up coming from the leather receiver gloves.
Jastremski told us that he set the pressure level to 12.6 psig after each ball was gloved and then placed the ball on a trunk in the equipment room for Brady to review.” (pg. 49-50)
To test the effects of rubbing a football, the Exponent Investigators measured the pressure increase in footballs which was caused by vigorously rubbing footballs for 20 minutes.
Problem #1. Assuming that the temperature in the room where Jastremski gloved the balls was 72F and the rubbing raised the ball pressure by about .35psi (about 1/2 the amount suggested as possible by the Exponent experiment), what would the pressure in the footballs as measured by Jastremski’s gauge be after they were allowed to cool to the temperature of 70F on the floor of the Officials Locker Room. Use the estimate of .05psig per 1F of cooling in your calculation. [ Ans. 12.15psig. Special note: The Wells report correctly stated that Bill Belichek got it wrong with the rubbing of footballs causing the football pressure to decrease after the officials measured the balls. The time intervals were just too long for that to happen. However, they failed to notice the effect it must have had on Jastremski’s measurement. ]
The referee had two pressure gauges. One gauge, nicknamed the Logo Gauge, read approximately .35psi too high. The other gauge, nicknamed the Non-Logo gauge read closer but slightly lower than the true pressure. The referee recalled using the Logo gauge for the pre-game measurements, but was not completely sure.
With the Patriot balls, and the Colt balls delivered to the floor of the Official Locker Room, the referee Walt Anderson then measured the pressure in the balls. The Exponent Investigators gave this account of their reasoning for deciding which gauge was identified as the gauge that was used to measure both the Patriots Balls and the Colts balls.
“According to information provided by Paul, Weiss, personnel from both the Patriots and the Colts recall gauging the footballs for their teams to pressures at or near 12.5 psig and 13.0 psig, respectively, prior to providing the balls to Walt Anderson. Each team used its own gauge to adjust the final pressures before presenting the balls to the referee, who used a gauge different from either used by the two teams to measure the pressure in the footballs. Walt Anderson recalled that according to the gauge he used (which is either the Logo or Non-Logo Gauge), all of the Patriots and Colts footballs measured at or near 12.5 psig and 13.0 psig, respectively, when he first tested them (with two Patriots balls slightly below 12.5 psig). This means that the gauges used by the Patriots and the Colts each read similarly to the gauge used by Walt Anderson during his pre-game inspection.
It has been shown that the Logo Gauge consistently reads higher than all other gauges analyzed in this investigation. As a result, it is very unlikely that the Logo Gauge would have read similarly to the gauges used by each team. Therefore, it is most likely that the gauge used by Walt Anderson prior to the game was the Non-Logo Gauge, which read similarly to the Master Gauge and other gauges tested during the investigation.”
Problem #2. Do you agree with the conclusion that the Non-Logo gauge was used to measure the Patriots balls? Why or why not? [Ans. No. Problem 1 showed that a conservative estimate of the pressure in the Patriots balls was about 12.15psig. It could have been lower. Using the Logo gauge would have given a measurement of 12.5psig, which is exactly what the Ref measured. Using the Non-Logo gauge would have given a measurement of about 12.15psig, well below that allowed by the NFL.]
To prepare for the question of Problem 3, here are two descriptions provided in the report:
“According to Paul, Weiss, the majority of the Patriots balls measured 12.5 psig when tested pre-game, and most of the Colts balls measured 13.0 or 13.1 psig.” (pg. 7)
Problem #3. If the Logo gauge was used to measure the Colts balls, what was the temperature of the Colts balls when the pressure was measured to be 13.0psig by the Colts?. Which gauge most likely was used to measure the Colts balls? [Ans: Based on the Logo gauge offset of .35psi, a 67F to 71F official locker room floor, and a referee measurement between 13.0psig and 13.1psig, the temperature of the balls when measured by the Colts would have been between 72F and 78F. If the Non-Logo gauge was used the temperature when measured by the Colts would have been between 65F and 71F. With this, it is inconclusive as to which gauge was used by the ref to measure the Colts ball. ]
Thought Question #1. Is it possible that one gauge was used to measure the Patriot balls, and the other was used for the Colts balls? To check your theory, you can try using different gauges in the Interactive DeflateGate Simulator.
Thought Question #2. Who is responsible for the Exponent investigators’ erroneous conclusion that the Non-Logo gauge measured the Patriots balls? Was it the investigators for not asking about whether the gloving of the footballs would have impacted the pressure measurement by Jastremski? Or was it the Paul, Weiss group for not providing complete information regarding the story of gloving the footballs and the pressure measurement by Jastremski?
Investigation #2. Transient behavior of Football Pressure Exposed to Different Temperatures
Before the game the balls were packed up into each teams respective ball bags by Jim McNally. On his way to the field with the balls, McNally stepped into the bathroom for 100 seconds to take a bio-break. The NFL describes what they think went on in the bathroom in this way:
Then McNally walked out from the tunnel onto the ball field. It was a wet windy day. Miraculously it was not very cold for January in New England. Every day in January up to that point had been in the 20’s. At game time is was 50F. Earlier in the day it had been 20F, but the temperature had risen dramatically since lunchtime from 20F to 50F. Rain was falling as a heavy mist, but by half-time it would be a steady drizzle and the temperature would drop to 48F. McNally walked onto the field and delivered the footballs.
The chart and description below was generated by the Exponent Investigators doing a simulation of the events of the day with the footballs assuming only natural causes affected the footballs. We can use this chart to see how the footballs change pressure as the temperature changes. This chart was used to both demonstrate the Ideal Gas Law (the drop in pressure of the dry balls), and the time required to bring the balls into equillibrium.
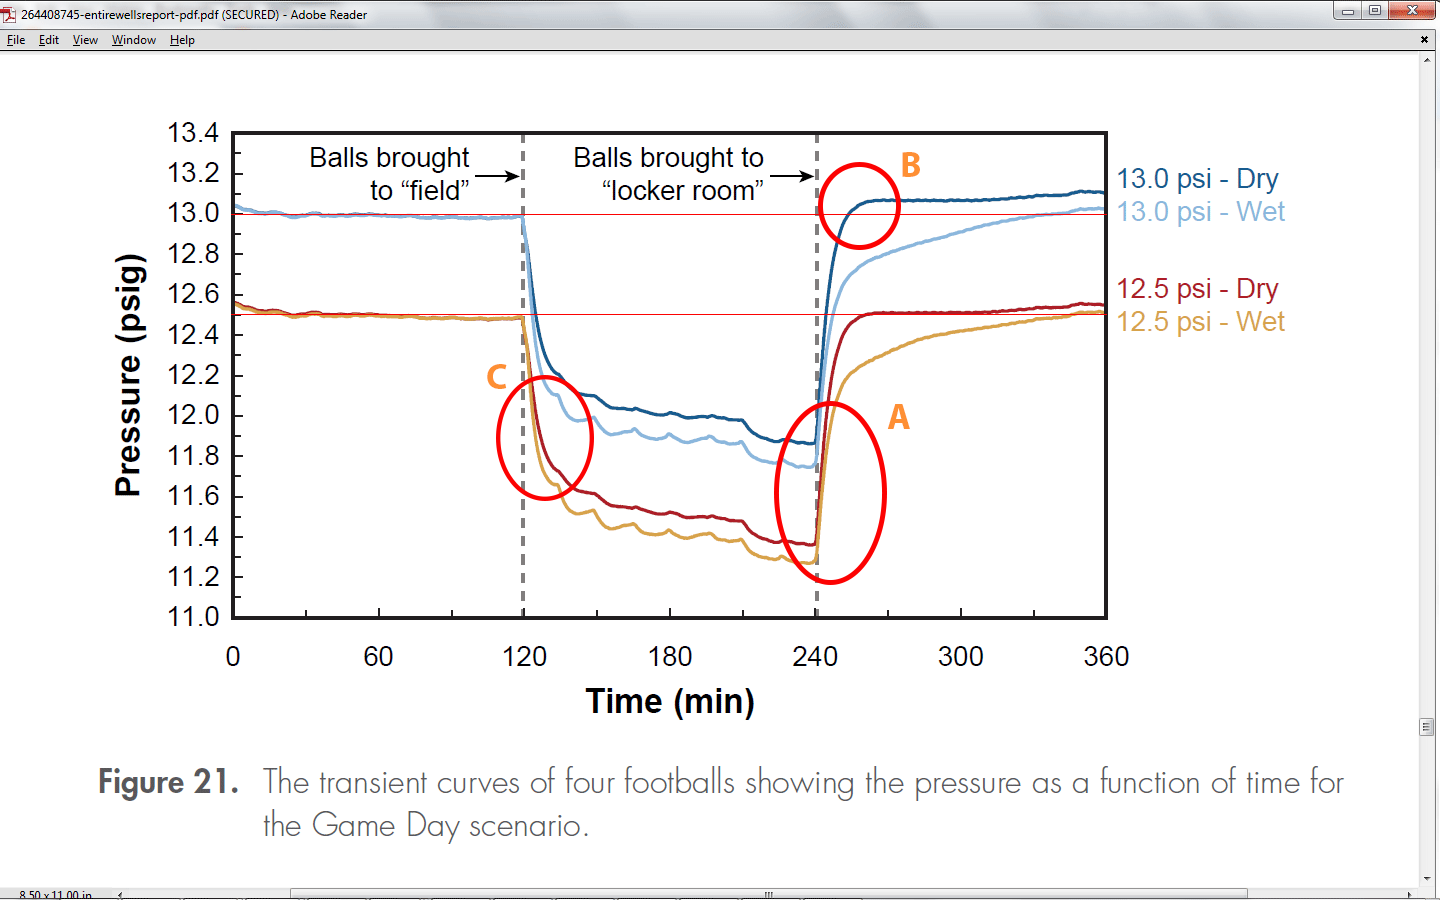
The time constant measured by a a quick expenential fit to the downward curve is about 8 minutes. This means that in 16 minutes after being exposed to a change in temperature, a ball will be about 87% of the way through the temperature change.
In the above chart, we see this in area C, where the balls have been brought to the field, and in about 8 minutes have dropped 62.3% of the way to their lowest pressure.
Because of the Ideal Gas Law, Pressure is proportional to Temperature for a constant sized football that does not change the amount of air inside. So a 62.3% change in Pressure is equivalent to a 62.3% change in Temperature.
We expect that rising in temperature, a dry football, should obey the same time constant for an exponential increase. In fact, the rising curve time constant for most of the information in the Wells report for dry footballs, appears to be about 11-12 minutes. It is unclear as to why this is the case.
Problem #1: In area B of the chart, we can see that the dry Colts ball crosses the line representing 69F after about 14 minutes of time coming from 48F. What is the temperature of the air it was exposed to? (Ans: 75F. The scientists claim a temperature of 72-73F, but in fact it must have been a bit higher, and then the temperature was turned down. It is actually quite difficult to control the climate in a confined space well, and there is a strong danger of your equipment over-compensating for the presence of the very thing you want to measure. There is not much description of this chamber they used, and how well it actually matched the Officials locker room climate. There is other evidence throughout the Exponent report that indicates problems managing the temperature, pressure and humidity in that chamber(1). Because of this, it is difficult to rely on some of their results from their measurements there. However, the physics in general is correct. But with the equipment not calibrated against the original room where the measurements actually took place, this raises an uncertainty of systemic effects that were not taken into account in their original considerations. In this document we rely often on the numerical calculations of the Interactive DeflateGate Simulator rather than the results of their measurements in that room, although for the most part (excepting Figs. 27 and 28), they agree with one another.
Problem #2 (optional): Physics tells us that the change in temperature of the football should be proportional to the temperature difference between the current temperature of the ball, and the temperature outside. Write a differential equation used to describe this condition. (Ans: We can write this as a differential equation
dT/dt = (T – T1)/tau
where tau is a constant, and T0 is the initial Temperature, and T1 is the final Temperature).
Problem #3 (optional): What is the solution for the temperature and pressure for this differential equation?
This has an exponential solution
T(t) = T1 – (T1-T0) * exp( -t/tau )
and by applying the Ideal Gas Law,
P(t) = P1 – (P1-P0) * exp( -t/tau )
Looking at the chart above you can see the exponential decrease of the ball pressure as the balls were moved from the warm temperature in the Officials locker room, and out into the cold playing area.
Investigation #3. Why do wet balls show a lower Pressure?
Here’s an experiment you can do easily at home. Place a dry leather football on your living room table beside a spray bottle filled with water. Let them sit for two hours, so you know that everything has equillibrated to room temperature, probably about 70F. You will need an IR temperature gun, something you can get at Home Depot. Also, the relative humidity outside for the day, or at least in your living room, should be at 40% or below.
Here’s what you need on a dry low humidity day:
- A dry leather football at room temperature.

- A spray bottle of water at room temperature.
- A temperature measurement gun.


The steps:
- Measure the temperature of the football ( should be about 70F).
- Measure the temperature of the water bottle (should be about 70F).
Now, before we do the experiment, try to predict the temperature of the football after you spray it with water. Did you guess 70F?
- Now spray the football with water. Try to cover the entire surface lightly.
- Wait about 1 minute. Now measure the temperature of the football.
Are you surprised with the result? (Should be 65F or below.) You can also try fanning the football with a piece of paper. Does the temperature drop even further?
This is an example of evaporative cooling. It is the same effect as that which cools your skin when you sweat. Water on the surface starts to evaporate, and with each molecule that evaporates, a significant amount of heat is taken away from the surface.
Doing the calculation of this effect is difficult. However there do exist charts which are used by atmospheric physicists, weather persons, HVAC engineers, etc to predict some of the effects. An important and useful chart is called Psychrometric Chart, which the interested student is invited to go look up on in the Internet, and learn how to use.
In the actual Officials Locker Room, the humidity on that day was 20%, so the temperature drop there would probably be more than what you just measured.
The Interactive DeflateGate Simulator does compute this effect. In fact you can insert the drop in temperature you measured on your football into the “Evaporative Cooling Offset”, and see its effect on the curves.
Problem #1 (optional): Use a Psychrometric Chart to determine the “wet bulb” temperature on a day when the regular temperature is 48F, and the relative humidity is 75% — the conditions at the AFC Championship game. (Ans: 45F. Why is this important? Because on a windy day, the effective temperature of an exposed football will drop to the wet-bulb temperature. Thus we expect the pressure will drop an additional .15 – .2psi on a wet football. Looking at the chart above, Figure 21 provided by Exponent, this is exactly what we see. The wet ball pressure is about .1 – .15psi lower that the dry ball pressure. )
Problem #2: Looking at Figure 21, we can see that the wet balls rise in pressure more slowly, and seem to fall about .3psi behind the dry balls at about the 15 minute mark. Relate this to the initial experiment you just did with the football and the spray bottle. Explain the long slow rise that occurred on the wet balls over the next hour. [Ans. Instead of 70F, the wet balls were rising to a temperature similar to what we measured in our experiment, a temperature about 8F lower or 62F. The long slow rise is due to evaporation as the ball dried. Once the ball was dry, it reached the original pressure and temperature.]
Investigation #4. The Ideal Gas Law
This Law has now been well covered in the media, and needs no further introduction here. A recent demonstration of it by a 7th grader’s science project using footballs is entirely accurate and correct, as are the calculations done by the Exponent scientists in their report (except figures 27 and 28). Read up on it. It is fun to find some calculations that were done incorrectly by “media experts” right after deflateGate broke. Even Bill Nye the Science Guy got it wrong.
The Ideal Gas Law is given by the following:
PV = nRT
The trick here is that the Pressure (P) is the absolute pressure which includes the weight of the atmosphere (1 atm, or about 14.696 psi at sea level, and about 14.55 psi at Foxborough stadium which is 257 feet above sea level, and 14.62psi if we adjust for the barometric pressure of 30.18 on January 18). This means that a measurement of 12.5 psig on the football is actually about 27.12 psia. Likewise Temperature (T) is the absolute temperature measured from Absolute Zero, which is -459o F. So a value for T at 71o F would be 530o.
So in all our calculations we have make the proper adjustment for the “absolute” values.
Other than that, the calculation is easy.
We can take our initial condition T1, P1, and V1 to be the starting measurement. The value of n which is related to the number of gas molecules, and R which is a constant, will be constant (unless the football leaks), then we can set up two equations if we want to figure out what happens at any condition P2, T2, and V2.
P1 * V1 = n * R * T1
P2 * V2 = n * R * T2
Dividing one equation by the other, we find that:
(P1/P2) *( V1/V2) = (T1/T2)
The parentheses are added for emphasis to show that the ratios are what we are concerned with. This saves us a lot of work with units.
Assuming there is no volume change (i.e. no stretching of the football), then V1/V2 is just the number 1, and:
P1/P2 = T1/T2
For most of the calculations involved in the DeflateGate controversy taking ratios is exactly what need to do. The actual numbers are only needed to show whether the calculations are consistent with temperatures and pressures measured on that day.
From these first 4 investigations we have enough to create a working numerical model of the ball pressure as it goes from the initial measurements in the officials locker room to the final measurements at half time. This model has been put on-line, so you can put in the starting conditions, and varieties of timings to see what comes out. We’ll use this model to compare the data in the next investigation.
Investigation #5. The Data. Does the Pressure Measure Up?

The on-line model accepts the following parameters:
Starting Pressure as measured by Walt Anderson: 12.5psi (Patriots Balls), 13.0 – 13.1psi (Colts)
Starting Room Temperature in officials locker room: 67F – 71F
Field Temperature: Dry Bulb — 48F, Wet Bulb — 45F
Ending Room Temperature: 72F – 73F
Effective Temperature Cooling For Wet Balls: -7F
Warming Time: 240 seconds (Patriots), 480 seconds (Colts)
Using these parameters, we get on the first try:
Patriots final gauge pressure: 11.52psig
Colts final gauge pressure: 12.34psig
This is extraordinarily close to the average halftime measurement — for the Patriots using the Logo gauge, and for the Colts using the Non-Logo gauge.
This shows two things.
- As the Patriots have claimed all along, using the Logo gauge, the Patriots footballs obey the laws of physics, with no tampering.
- There is a simple model which allows both the Patriots footballs, and the Colts footballs to match the laws of physics together, with no tampering.
Question #1: Using the online simulator, try a range of values for the starting temperature (67F – 71F), and a range of wet ball variances, and a range of warming times. This should give a feel for the uncertainty in the ball pressures just due to the uncertainty in the initial conditions.
Investigation #6: The Unfortunate Figures 27 and 28
You might ask how it happened that the Exponent Scientists did not display the fact that the Patriot pressures match the Ideal Gas law when the Logo gauge was used. Figure 27 and Figure 28 were the opportunity to do so, which displays the transient part of the curves as the balls were measured in the half-time measurements using the Logo gauge.
This chart shows what happened in the locker room at half-time. The labelled curved bands are the rising ball pressures which the Exponent Scientists measured in their chamber for dry balls and wet balls respectively. The horizontal bands represent the measure ball pressures with their uncertainties. Areas of overlap represent possible ranges where the two agree.

Here is the explanation given for figure 27:
“In this scenario, the game temperature and the halftime measurement temperatures were set to the same values (for the same reasons) as the experiments done with the Non-Logo Gauge (48°F for the game and between 72 and 73°F for the halftime measurement temperatures). However, the pre-game temperature was set at 67°F because this was the only temperature that allowed the Colts balls to subsequently reach their average pressure during the simulated Locker Room Period. Any pre-game temperature that was higher than 67°F resulted in the Colts balls reaching the Game Day halftime average pressure later than 13.5 minutes into the Locker Room Period.”
First, lets explain the Pressure scales. The chart shown here is measured relative to the Master Gauge, which accurately represents the actual gauge pressure, rather than the Logo gauge which read high by more than .33psi. So, the if the gauge pressure of the Logo gauge shows 12.5psig, the Master gauge will show 12.17psig.
Problem #1: If the Master gauge has a starting pressure reading of 12.17psig, and the temperature drops 19F, what pressure should the Master gauge read once a dry ball has had a long time to stabilize. (Ans: 11.22psig)
Problem #2: Reading the chart, what is the pressure reading on the Patriots dry ball? Can you account for this violation of the Ideal Gas Law? (Ans: 11.55psig, which is about .33psi too high. Since the Ideal Gas Law could not have been violated, this is an apparent mistake by the Exponent Scientists when adjusting the scales, or in performing the experiment. To truly test the Logo gauge, the starting Master gauge pressure should have been set to 12.17psig. The pressure of the Pats balls based on the Master gauge is correct as shown. )
Problem #3: Look at the last statement of the paragraph from the Wells report given above. If the temperature was set to 68F instead of 67F, how much would the starting dry ball pressure of the be lowered. Does that coincide with the statement made about being later than the 13.5 minutes? (Ans: .05psi. This looks like it may have shifted the time by about 1 minute on this chart and does not make sense with the statement. However, assuming the mistake on the scaling as deduced in Problem #2 did in fact occur, and the transient curves need to be shifted down about .33psi, then this statement becomes true.)
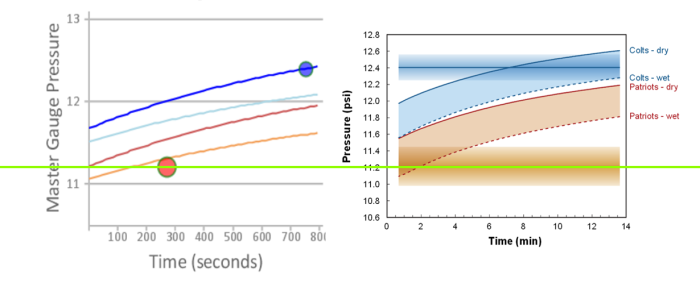 A side-by-side comparison of the theoretical model from the Interactive Simulator, and Figure 27 from the Exponent experimental results. The bright green line at 11.2psig is the expected starting value for the Patriots – dry ball. Figure 27 shows this location as being more than .3psig above that location – in violation of the Ideal Gas Law. The Colts curve shows a similar problem.

This chart is the fundamental basis for the Wells Report claim that neither gauge provided a satisfactory explanation for the Patriots pressures. Unfortunately, had they not made the mistake as described above, they would have come to a much different conclusion.
The observation of problems with this chart were first made by Steve McIntyre in June, 2015. He wrote letters to Ted Wells of the Wells report, and to the lead investigator of the Exponent report. No response or explanation has been given.
Investigation #7. The Distribution of Pressure Measurements
It might seem like we are done here. But we still need to look at the actual pressure measurements themselves. Referee Walt Anderson described the balls as all being close to 12.5psig for the Patriots, and as being between 13.0 and 13.1psig for the Colts. Yet, what we see in the table above is a wide variation in pressure. If indeed the only truly variable effect was the wetness, we would expect to see two clumps of measurements: dry balls, and wet balls.

The Exponent investigators displayed the distribution of the footballs as measured. Look in particular at the bottom line, for the Patriots Logo gauge. There are a cluster of balls close to 11.5psi, which is what we expect, for wet balls. There are a couple of balls at a higher pressure which is what we expect for dry balls and the Patriots claimed that they had a couple of balls that were still dry. But we have some significant outliers. Look at the two near the 11.0 psig mark. Are these two balls which were deflated? And look at the ball at 12.3psi. Is this a ball that was inflated?
Question #1: To have balls that were significantly lower in pressure, yet not tampered with requires a significant source of cold that was below the wet bulb air temperature. What is that? Hint: remember that it was 20F early in the morning. And the temperature rose suddenly to 50F by the afternoon. (Ans: the playing field itself. Although covered with a layer of synthetic nylon grass, the field underneath would still have been cold due to the previous weeks of cold temperatures. The Patriots had a long sustained drive just before halftime, and several balls spent a significant amount of time in direct contact with the wet field, and would not have had time to equillibrate before the half-time measurements. Note: this scenario will be tested with the numerical model soon …
Observation #1: To have a single ball that was so high in pressure is very troubling. Either the ball was placed next to a heat source prior to the measurement, which seems unlikely, or the ball simply followed a very different pattern to be a part of this collection. Note that the Patriots only should have had 10 balls in their group, and not the 11 that showed up. Out of the initial dozen one was kept by the Colts due to an interception, and another was kept by a Pats player who scored a touchdown. So where did the 11th ball come from? Did a practice ball get mixed into the group by mistake? Could that be the ball?
Conclusion
So what do you think? It seems that the Logo gauge must have been used to measure the Patriot footballs. Using the simulator we find that within the standard error constraints the Logo gauge can explain the both the Patriot measurements and the Colts measurements together!
It is also possible that the gauge switch theory during the pre-game measurements might have happened. This interesting scenario also allows everyone to be telling the truth, and it may have been a simple misunderstanding of information on the ball preparation between Exponent and the Paul, Weiss group that would explain it being overlooked. The significant thing is that both the Colts balls and the Patriots balls fit extremely well with the Physics in this model. It is highly unlikely that you would get such a fit if there had been any tampering anywhere.
Appendix A. UNITS — What in a psig, a psi, or a psia?
What’s the difference between a psi, a psig, and a psia? When we measure the pressure in a football, we use a gauge that measures the pressure difference between the inside of the football, and the outside of the football. This is called a psig (the g on the end is for gauge) and is a relative measurement. If we add on the pressure of the atmosphere bearing down on both the gauge and the football, we get the absolute pressure, which is psia. Use the word psi to refer to delta’s beyond that. For example there is a .5psi difference between the 12.5psig gauge reading for the Patriots footballs, and a 13.0psig gauge reading for the Colts footballs. And there is a 14.7psi difference (about 1 atm) between the absolute 27.2psia pressure on the Patriot footballs, and the 12.5psig reading measured for the Patriots footballs. Since the atmospheric pressure did not change much during the Patriots game, I find it okay to call the difference in pressure between the inside of the football and outside to be called by the name psi, but most purists would insist on calling it psig, since it is a gauge measurement. The Exponent scientists clearly fall into the purist camp, which is a fine attribute to have.
